
Data Storytelling for Beginners: From Excel Sheets to Strategic Narratives
You’ve collected all the numbers. Your spreadsheet is organized and full of formulas. But when you present it, people just look confused. They don’t see the story you see.
This happens because data analysis and data communication are two different skills. Knowing what the numbers say is not the same as helping others understand why it matters. This guide will show you how to bridge that gap.
We’ll use simple, practical steps you can apply right away with tools you likely already have. The goal is to turn your Excel sheets into clear, compelling narratives that get noticed and drive decisions.
Data storytelling is the skill of combining your data, simple visuals, and a clear narrative to communicate key insights. It’s not about fancy graphics; it’s about clarity and focus. By following a structured method, you can transform a basic chart into a professional story that guides your audience to the right conclusion.
The core problem: the gap between analysis and communicati
- The core problem: the gap between analysis and communication
- The three essential elements of a data story
- A step-by-step framework: the C.L.E.A.R. method
- A real-world case study: from data dump to professional narrative
- Insights from a founder’s perspective
- Pro-tips for moving beyond basic tools
- Future career trends and applications across industries
| Item | Detail |
|---|---|
| Best first contact | For learning, use guides on platforms like Digital Life Guide. For tool-specific help, consult official support for Excel, Power BI, or Tableau. |
| Main safety warning | Avoid visualizing data in a way that manipulates the audience, such as truncating chart axes to exaggerate small changes. Honesty is critical. |
| When to call a licensed professional | When you need advanced interactive reports, custom web-based visualizations, or have strict data governance and ethical requirements for official business reporting. |
Who should I call first
- Who should I call first? Start with your internal mentor or manager for feedback. For tool issues, use official Microsoft or Google support.
- What will it cost? You can start for free using Excel or Google Sheets. Advanced tools like Power BI or Tableau may have licensing costs.
- What proof is needed for warranty? Not applicable to this skill. Focus on building a portfolio of your work to demonstrate competency.
- Which state or local office should I check? Not applicable. Verify data sources and methodology with your organization’s data or compliance team.
- What are the warning signs? Presenting overly complex charts, using misleading visuals, or failing to provide clear context are major red flags.
- When should I avoid DIY? When creating mission-critical reports for executive decisions or public consumption where data accuracy and narrative clarity are paramount.
| Main customer question | Best first contact | Estimated cost range | Important URLs |
|---|---|---|---|
| How do I start learning data storytelling? | Online educational guides and official software tutorials. | Free (with Excel/Sheets) to premium software licenses. | Official websites for Microsoft Excel, Google Sheets, Power BI, Tableau, Flourish. |
| What tools should I use? | Software official support channels. | Varies by tool; many have free tiers or trials. | Check the tool’s official site for the most current pricing and features. |
| How do I know if my visualization is ethical? | Your organization’s data ethics or compliance officer. | No direct cost, but integrity is priceless. | Professional guidelines from data visualization societies. |
The Gap Between Analysis and Communication
Most of us are taught to use charts to explore data for ourselves. In a professional setting, you need to use charts to explain data to others. This is a crucial difference.
When you show a default Excel chart, you ask your audience to do the work. They must read the labels, compare the bars, and figure out the meaning. This creates high “cognitive load.” If your audience has to think too hard, they will disengage.
Your job is to reduce that load. Guide them directly to the insight so they can focus on the decision, not the deciphering.
The Three Elements of Data Storytelling
Every effective data story is built from three core components. You need all three working together.
- Data: This is your foundation. It must be accurate and trustworthy. It’s your evidence.
- Visuals: This is your lens. A good chart reveals patterns and relationships that are invisible in a table of numbers.
- Narrative: This is your glue. It provides the context, explains the “so what?,” and connects the data to real-world actions.
Call a Pro If: You are preparing a high-stakes report for company leadership or investors and lack confidence in your narrative. A professional can help frame the story correctly.
If you have data and visuals but no narrative, you have an art project. If you have a narrative and data but no visuals, you have a dry report. The combination of all three drives action.
Step-by-Step Framework: The C.L.E.A.R. Method
Don’t just click “Insert Chart.” Follow this structured approach to think like a designer and a strategist.
C, Context
Before opening Excel, ask two questions: Who is my audience? What do they care about most?
Example: You’re reporting to the Marketing Director.
- Bad Approach: Show a table of all 50 marketing campaigns with their click-through rates.
- Good Approach: Focus only on the top 5 and bottom 5 campaigns. This highlights what worked and what failed, directly addressing their need for actionable insights.

L, Layout (Choosing the Right Visual)
Choosing the wrong chart is a common mistake. Avoid pie charts, as they are difficult for the brain to compare accurately.
- Use a Line Chart to show change over time.
- Use a Bar Chart (horizontal bars are often more readable) for comparing categories.
- Use a Scatter Plot to show a correlation or relationship between two measures.
E, Eliminate Clutter
Default charts are noisy. To look professional, you must declutter. Remove any element that doesn’t add information.
- Remove the default grey background fill.
- Delete or make gridlines very faint.
- Remove the border around the chart area.
- If data labels are on the bars, consider removing the vertical axis.
Every pixel should justify its existence. If it doesn’t add information, it’s just noise.
A, Attention (Strategic Color)
Color is for direction, not decoration. Don’t use a different color for every bar.
Scenario: You need to show that sales in Mumbai are lagging. - Action: Make the bars for Delhi and Bangalore a soft grey. Make the Mumbai bar bright red. Your audience’s eyes will instantly snap to the problem.
R, Reasoning (The Narrative)
Add the text that tells the story. Never leave the default title.
- Descriptive Title (Weak): “Revenue by Region.”
- Active Title (Strong): “Mumbai Revenue Dropped 15% in Q3 Despite High Footfall.”
Your chart title should state the main insight. Even if someone only reads the title, they get the message.
Case Study: The Monthly Performance Report
Let’s see the C.L.E.A.R. method in action with a real work example.
Scenario: You’re an intern at a logistics company presenting delivery times for the last six months.
Phase 1: The "Data Dump" (The Common Mistake)
You select the data and insert a default 3D column chart. It has a legend, dark gridlines, and six different colors. You title it “Average Delivery Times.”
Result: Your manager says, “Okay, thanks.” They learn nothing. The 3D effect distorts the bars, making the trend hard to see.
Phase 2: The "Professional Narrative" (Using C.L.E.A.R.)
- Context: The goal is to reduce delivery times to under 2 days.
- Layout: Switch to a simple 2D Line Chart to clearly show the trend over time.
- Eliminate: Remove gridlines, the background, and the legend.
- Attention: Make the line dark grey. Add a dotted red reference line at the “2-Day” target. Highlight the May and June data points in red because they exceeded the target.
- Reasoning: Change the title to: “Delivery Times Spiked in May/June Due to Vendor Strike.”
Result: The manager immediately sees the red dots above the target line and understands the cause. The conversation shifts from “What is this?” to “How do we prevent this in the future?” You’ve moved from reporting data to solving problems.
Do Not Ignore: The ethical use of data. Never truncate a chart’s Y-axis to make a small change look huge. This manipulates the audience and destroys trust.
A Founder’s Perspective on Clarity
When reviewing reports, founders and investors don’t have time to be detectives. Some try to impress with complex, dense charts that show everything at once. They mistake complexity for competence.
In reality, clarity equals competence. The most impressive junior employees are those who respect the leader’s time. They don’t send a spreadsheet. They send a screenshot of one clear chart with a headline and a single sentence of context.
This builds trust faster than any complex algorithm. Your goal is not to show how much data you have. It’s to show you understand what it means for the business.
Pro-Tip: Moving Beyond Excel
Excel is the standard, but advanced storytelling often needs more interactivity.
The Tooltip Technique: In static slides, you can’t hover over data. Simulate this by using direct labels on the chart. If you learn tools like Power BI or Tableau, focus on customizing tooltips.
Don’t let a tooltip just show “Revenue: $5k.” Configure it to say: “Revenue: $5k (down 10% from last month due to inventory shortage).” This embeds the narrative directly into the data.
Future Career Trends: The Rise of the "Data Translator"
By 2026, AI will handle the “what” – it will generate charts and spot trends instantly. This makes the human skill of storytelling more valuable, not less.

- Automated Insights, Human Context: AI can tell you sales are down. It won’t know sales are down because a competitor opened nearby. The “Data Translator” provides the real-world context.
- Interactive Data Experiences: Static slides are becoming outdated. The future involves interactive “scrollytelling” reports where charts animate as you scroll. Learning basic tools like Flourish can set you apart.
- Ethical Data Storytelling: With deepfakes and AI errors, trust is fragile. Professionals known for honest, transparent visualizations will become essential guardians of truth in their organizations.
Application Across Industries
This skill is not just for analysts. It’s valuable in every department.
- For HR: Don’t just report “Turnover is 10%.” Show a bar chart of turnover by department, highlight Engineering in red, and title it: “Engineering Risk: Turnover is Double the Company Average.”
- For Marketing: Avoid pie charts of social media followers. Use a bar chart comparing “Engagement Rate” instead of “Follower Count” to show you value quality over quantity.
- For Finance: Move beyond dense P&L tables. Visualize the “Burn Rate” using a Waterfall Chart to show exactly where cash is going each month.
DIY is usually safe if: You are creating internal reports, practicing your skills, or presenting to a supportive team. You have the time to learn and apply frameworks like C.L.E.A.R. using Excel or Google Sheets.
You should call a licensed professional if: You are creating investor pitch decks, official public reports, or complex interactive dashboards. Also, if the data narrative carries legal, financial, or significant reputational risk for your organization, a professional data storyteller or designer is warranted.
DIY Is Usually Safe Only If: You are committed to ethical visualization and have verified your data’s accuracy. The cost of a mistake in a key report can be high.
For learning and skill development, start with online educational resources and guides. For technical help with software, contact the official support for your tool (e.g., Microsoft Support for Excel, Google Workspace support for Sheets).
For feedback on your storytelling, seek out a mentor, manager, or a colleague known for clear communication within your organization.
For the tools mentioned, always use official channels for the most accurate information:
- Microsoft Excel & Power BI: Support via the official Microsoft website.
- Google Sheets: Help via Google Workspace support.
- Tableau: Resources and support via the Salesforce/Tableau website.
- Flourish: Guides and support via the Flourish website.
This is not applicable to learning a skill. Your “warranty” is the quality of your work portfolio. To ensure your work stands up to scrutiny: 1. Always document your data sources. 2. Keep notes on why you chose specific charts and narratives. 3. Be prepared to explain your methodology if questioned.
State-Specific or Local Checks
Not applicable for this digital skill. However, if your work involves industry-specific data (e.g., healthcare, finance), always check your organization’s compliance and data governance policies.
What to Ask Before Paying for a Course or Service
If you consider paying for advanced training or hiring a consultant:
- What specific framework or methodology do you teach/use?
- Can I see examples of before-and-after transformations from your students/clients?
- What tools will I learn, and are there ongoing licensing costs?
- Do you cover the ethics of data visualization?
Be cautious of: - Any training or advice that encourages mis
Be cautious of:
- Any training or advice that encourages misleading visuals, like manipulating chart axes.
- Professionals who prioritize flashy effects over clear communication.
- Anyone who cannot clearly explain why they chose a specific chart type for a given story.
- Tools or methods that seem overly complex for a simple message.
Practical Step-by-Step Guidance
Before your next presentation, follow these steps:
- Define the Audience: Write down the one question your audience needs answered.
- Find the One Insight: In your data, what is the single most important finding? Ignore everything else for now.
- Sketch on Paper: Draw a simple version of the chart that would best show that insight.
- Build in Excel: Create the chart, then aggressively remove all clutter (gridlines, legends, borders).
- Apply Strategic Color: Use one bold color only to highlight your key insight. Make everything else grey.
- Write the Narrative Title: Craft a title that states your finding as a complete sentence.
- Practice Your One-Liner: Prepare a single spoken sentence to introduce the chart that reinforces the title.
Frequently Asked Questions
What is data storytelling in simple terms?
It is the practice of combining data, visuals, and a narrative to communicate insights clearly. It turns raw numbers into a understandable story that drives decisions.
What tools do I need to start?
You can start with Microsoft Excel or Google Sheets. As you advance, tools like Power BI, Tableau, or Flourish offer more interactive capabilities.
How is data storytelling different from data visualization?
Data visualization is about creating charts. Data storytelling adds context, narrative, and strategic emphasis to guide the audience toward a specific insight and action.
What careers require data storytelling skills?
Almost every modern role benefits from it, including marketing, HR, finance, consulting, product management, and business analysis.
How can students practice?
Take any class project dataset and apply the C.L.E.A.R. framework. Focus on creating one clear insight per chart, rather than showing all the data you have.
This guide is based on professional frameworks for data communication and visualization. The principles of the C.L.E.A.R. method and ethical visualization are standard in the field.
For tool-specific instructions, always refer to the latest official documentation from Microsoft, Google, Tableau, and Flourish, as software interfaces and features change regularly.
Data storytelling is a powerful skill that makes your work more impactful. Start with the next chart you make. Remove the clutter, highlight the insight, and write a title that tells the story.
Final Reminder: Always verify your data sources and methodology. For high-stakes business reports, have a colleague or manager review your narrative for clarity and accuracy before presentation.
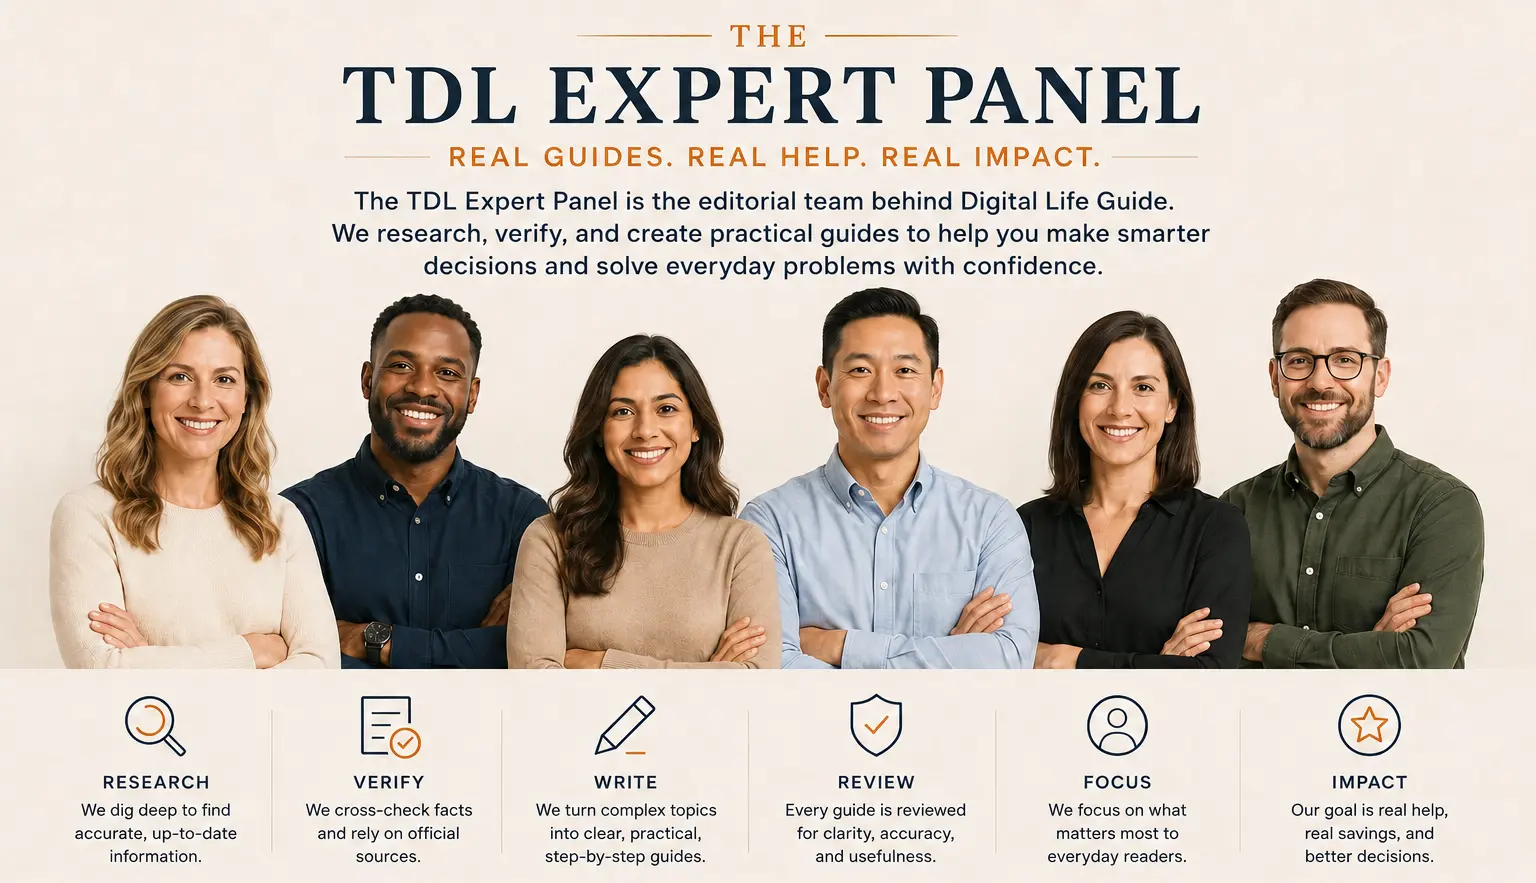
About the TDL Expert Panel
TDL Expert Panel · TheDigitalLife Editorial Team
TDL Expert Panel is the editorial team behind TheDigitalLife. The team researches, reviews, and creates practical guides to help everyday readers make better decisions about home repair costs, refunds, AI tools, digital safety, productivity, and useful online resources. Each guide is written to be clear, useful, and easy to understand.